15 January 2018 | 5 min read
Reading Between the Lines

Cryptocurrency mania has brought technical analysis to a new wave of speculators, but traders have been trying to profit from price patterns for centuries.
Technical analysis involves using historical price and volume data to predict market movements. It can be applied in markets ranging from wheat to the latest speculative craze, cryptocurrencies. One Bitcoin pundit, for example, recently discussed the appearance of an "inverse head and shoulder breakout" after the digital currency surged 10% within 24 hours, claiming that “...BTC is trading well above the neckline hurdle of $15,550... prices could rise to $18,600 (target as per the measured height method) over the weekend”. Others have enthusiastically cited the prospect of Fibonacci retracement as a trading signal.
As futuristic as divining the future of digital currencies may seem, attempts to do something similar in other financial markets have a storied past. Primarily relying on intuition and hand-drawn graphical representations of data, early “technicians” were at worst con artists. At best, their approach was crude and lacked the rigour or science of modern systematic investment managers, which use the latest technological and statistical techniques to scour petabytes of data.
Technical analysis pioneers had the foresight, however, to appreciate the opportunities for profit created by crowd psychology. They also instigated the use of charts to navigate peaks and troughs. The series displayed in the GIF below, which has been taken from Winton’s archive, exhibits some of the more common – and more unusual – price patterns identified in financial markets, from "head and shoulders" and "double bottoms" to "rising scallops" and the "reverse horn".
18th Century Crowd Surfing
“Night and morning attacks”; “advancing three soldiers”; “counter attack lines” ‒ candlestick chart patterns with such names hint that technical trading first started at a time when the military held sway. And in Edo-period Japan, traders applied technical analysis as they sought to profit from Osaka’s rice futures market.
Munehisa Homma, a speculator and effectively an early behavioural economist, produced some of the earliest descriptions of technical patterns in writings such as The Fountain of Gold—The Three Monkey Record of Money. He attributed trends and reversals to the human emotions exhibited in market behaviour. In Japan, candlestick charts used by technical traders are known as Sakata charts, a fitting reference to Homma’s hometown.
Illuminating Candlestock Charts
A staple of technical analysis today, candlestick charts are thought to have been developed by traders in19th century Japan, but were not widely used outside the country until the 1990s. Technical analyst Steve Nison is credited with popularising the graphs in the United States early in the decade with a series of articles and books.
The crude oil futures chart, taken from Nison’s 1991 book Japanese Candlestick Charting Techniques, provides an example. White (black) boxes indicate daily market gains (losses). The tops and bottoms of the boxes indicate the market’s opening or closing prices, while the lines capture the daily highs and lows.
The candlestick format has its own set of technical patterns, including the hanging man, dark-cloud cover (depicted here), shooting star, dumpling tops, and some of a military theme mentioned above.

Across the East China Sea, Confucian manuals published rules of thumb to help forecast price movements in the bustling markets of Imperial China. Essential Business, one such manual, explained how “no item will remain expensive for over one hundred days and no item will remain cheap for one hundred days”. The same guides purported to show merchants how to identify market manipulation, understand relationships between price and volume, and handily how to develop a honed Confucian disposition.
These are just two of the many precursors of modern technical analysis that academics and practitioners have traced; other examples date back to ancient Babylon.
Start of a Trend
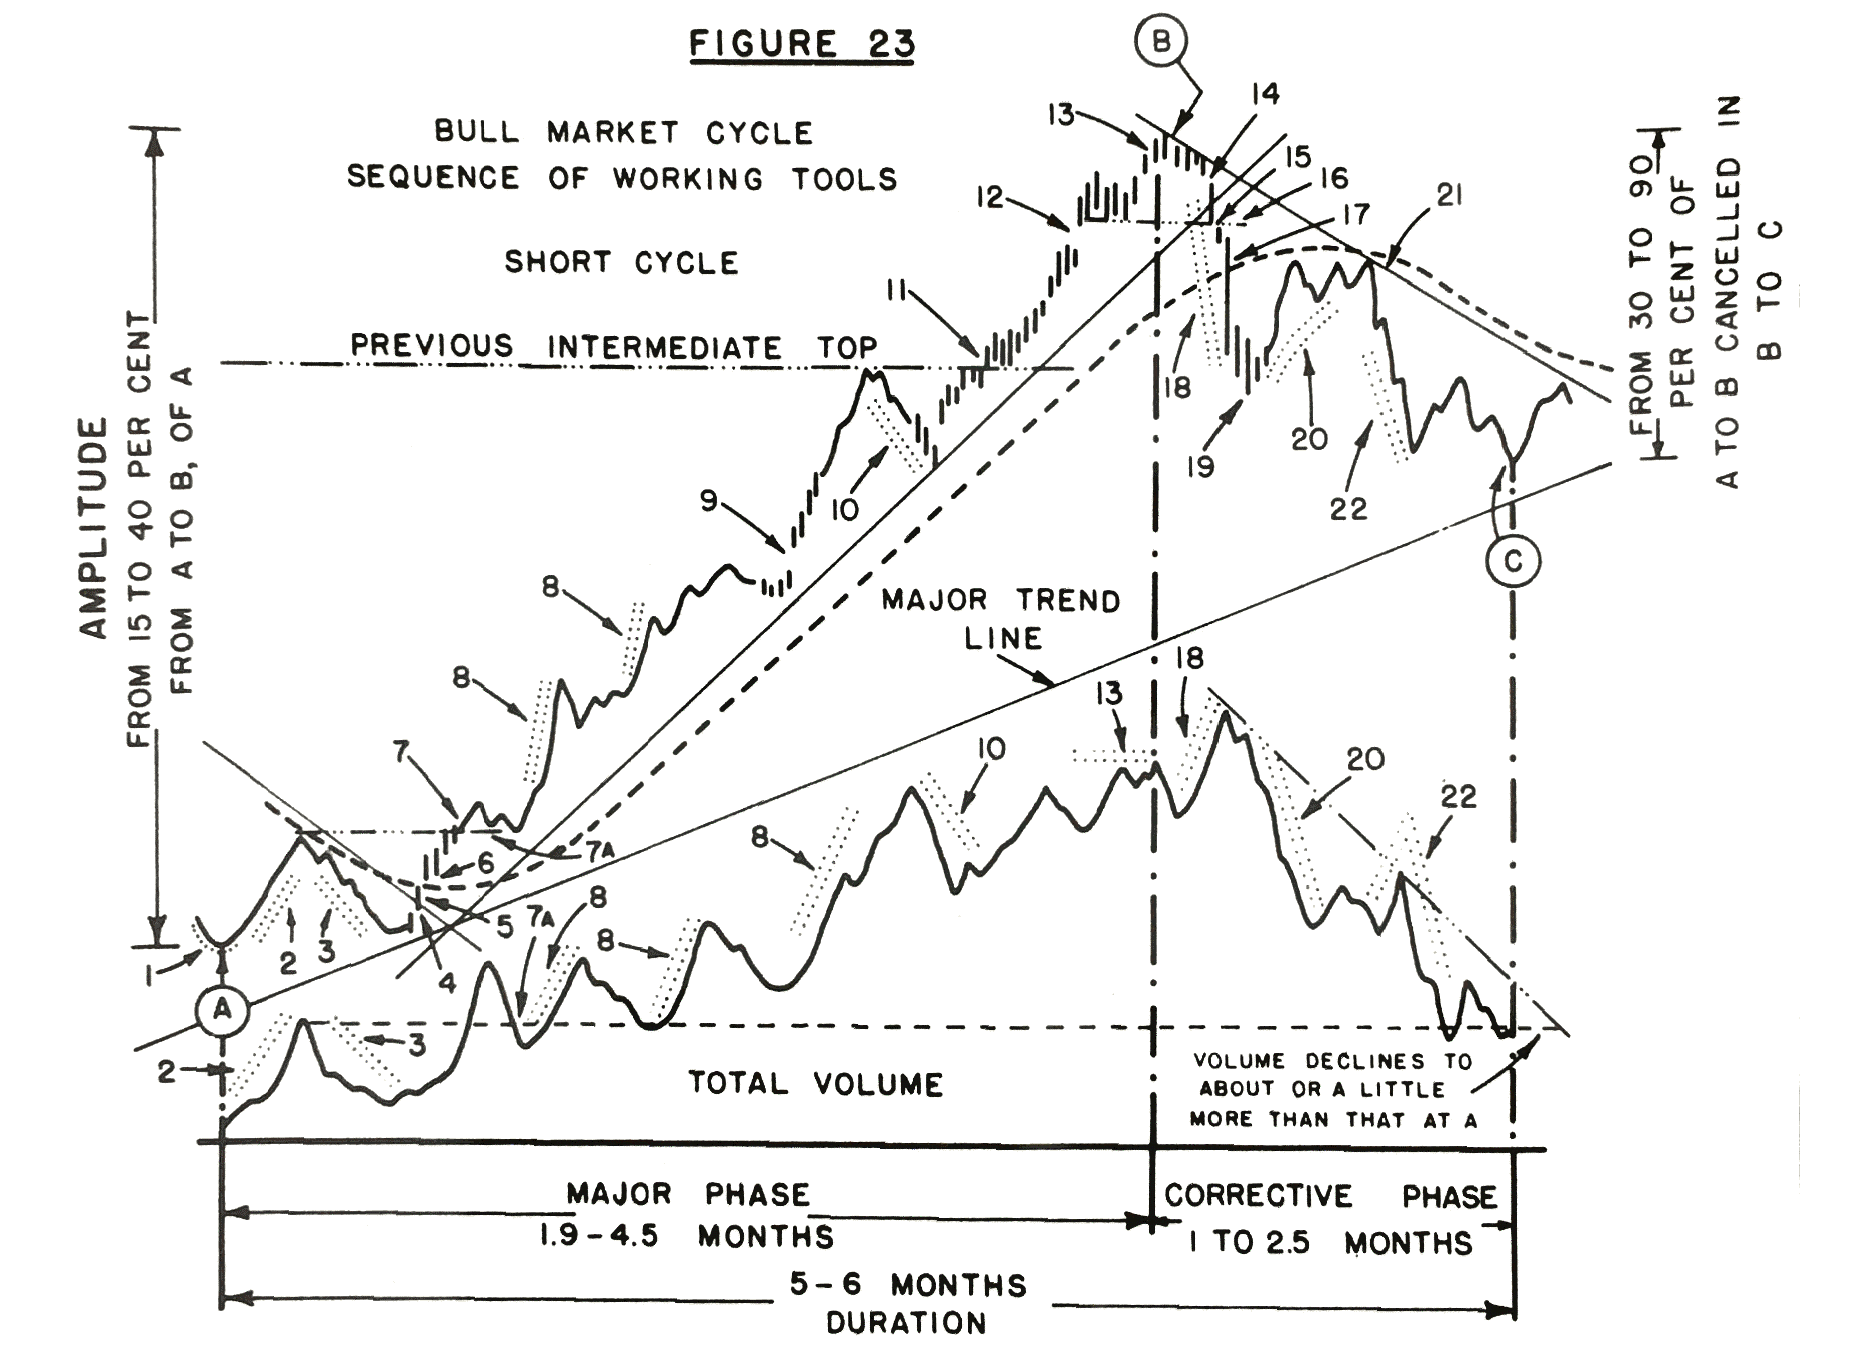
From Edo-period Japan fast forward to the late 19th century, when inventions such as the ticker tape prompted information about US financial and commodity markets to proliferate. Chicago’s commodity traders closely tracked changes in prices, hoping to anticipate the actions of the trusts, pools and rings – the big market players of the day. In New York, meanwhile, financial journalist Charles Dow developed stock price averages to study market movements as interest in Wall Street grew.
Using his railroad and industrial equity indices, Dow sketched out what would become known as “Dow Theory” in his brainchild publication, The Wall Street Journal. Dow observed that markets trend in three ways:
- Primary or major trends ‒ bullish or bearish ‒ measured in years
- Secondary or intermediate trends of a few weeks or more, erasing a third or more of the gains or losses of the primary movement
- And minor trends of a few days
Following Dow’s death in 1902, acolytes expanded on his ideas and sought to profit from markets by riding out trends, before jumping ship when they detected a reversal. Dow’s followers used charts to identify these opportunities. In doing so, they were often put into the same camp as charlatans and snake oil salesmen.
“We see many lamentable characters trudging from one broker’s office to the next,” Dow theorist H.M. Gartley wrote in 1938, “with a few besmudged charts under their arms, suggesting…just exactly what the market is about to do. When questioned, they have many explanations as to why their previous judgments were in error.”
The risk of being associated with the rogues they dubbed “chartists” failed to discourage most Dow theorists. Classic chart patterns such as the head and shoulders, flags and pennants and the golden and death crosses will likely be familiar to today’s technical analysts.
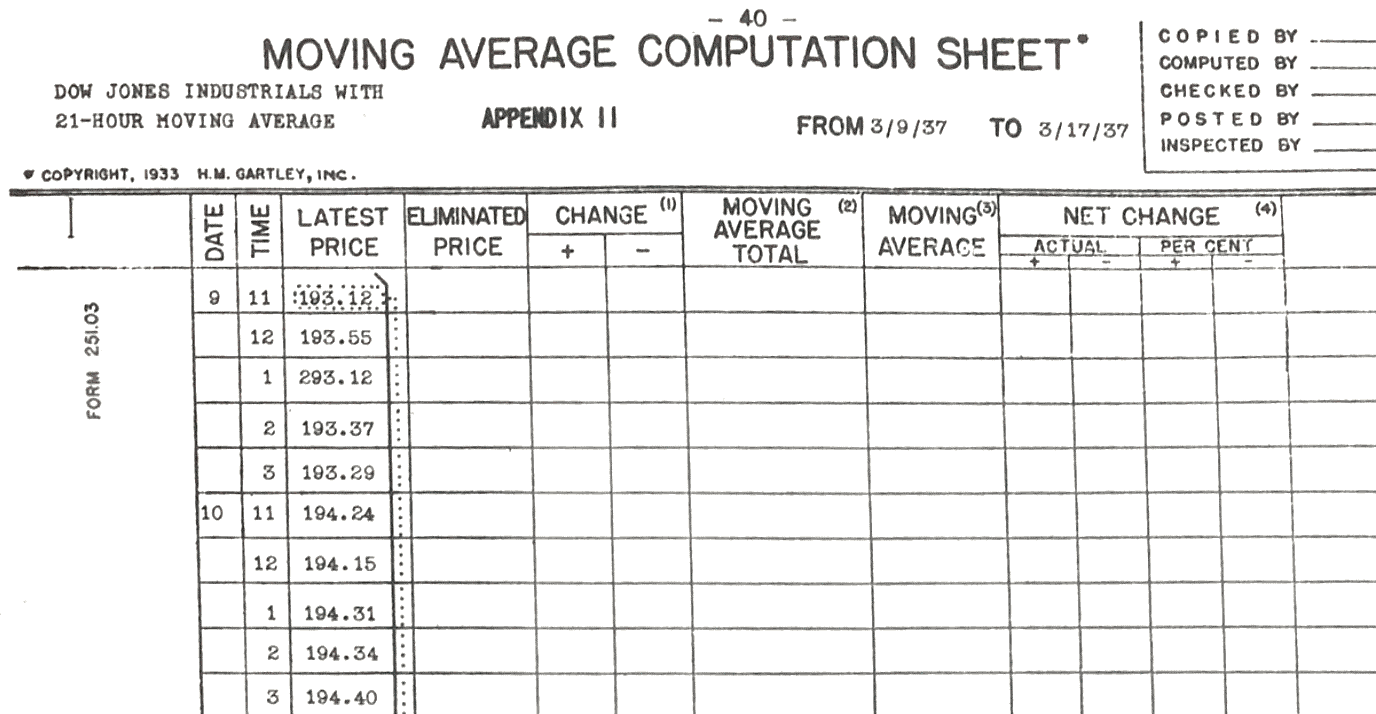
Not all the Dow theorists’ work was spurious, though. A key weapon in their arsenal was the moving-average crossover, a signal for which many have since found empirical evidence.
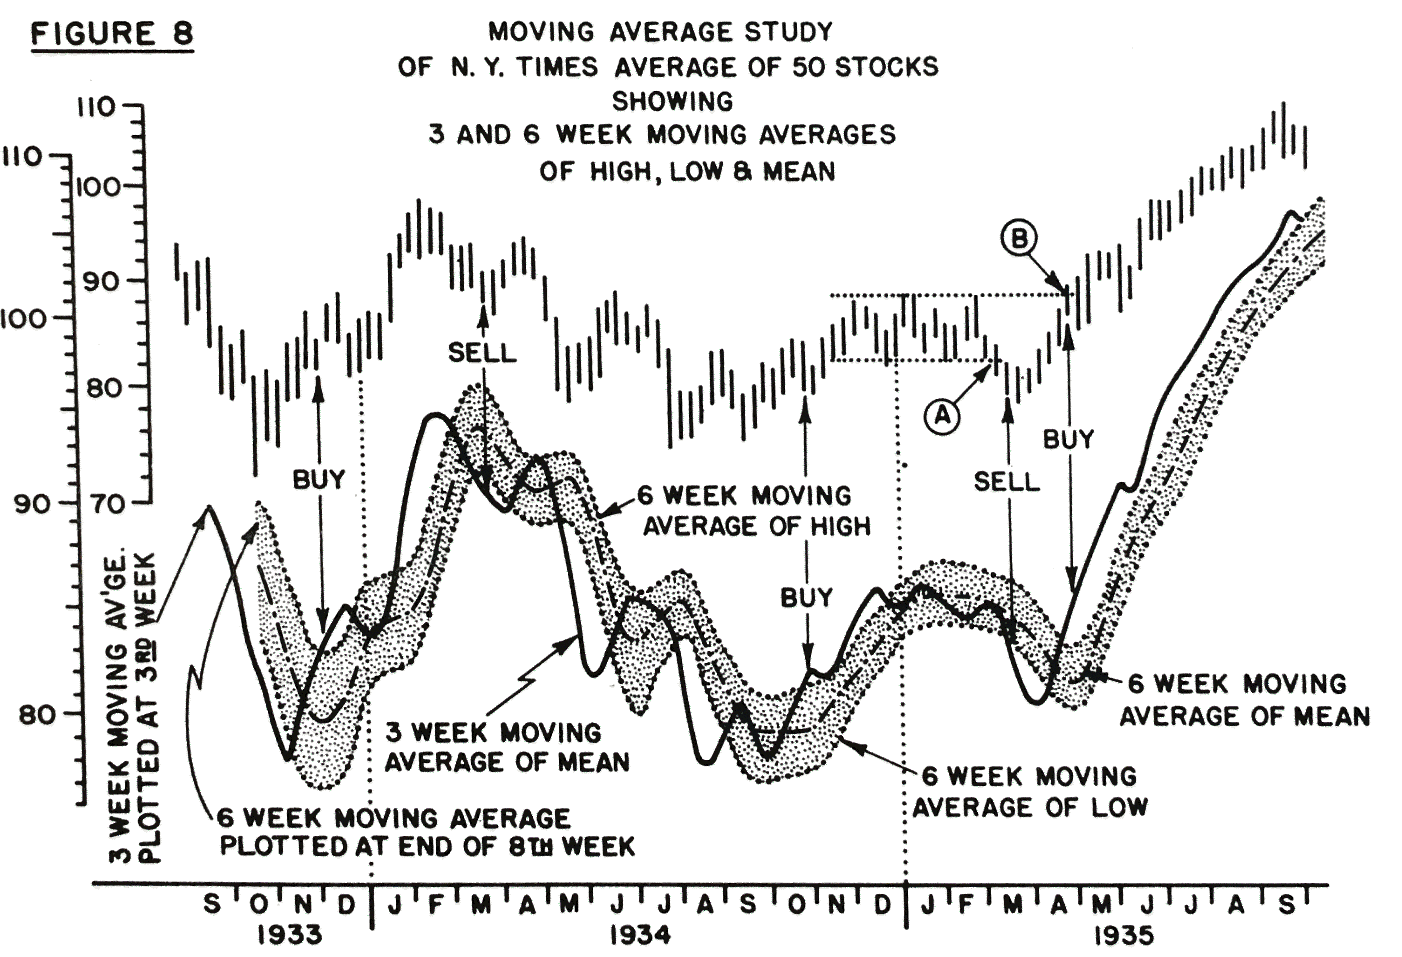
Manually calculated by updating tables such as the computational sheet shown below, moving-average crossovers of different periodicities could provide buy and sell signals. Similar ideas lie at the core of simple trend-following systems today.
Technical Signals Go Mainstream
In the second half of the 20th century, systematic strategies with faint echoes of technical analysis were widely adopted by commodity traders and hedge funds ‒ and later super-charged by computers.
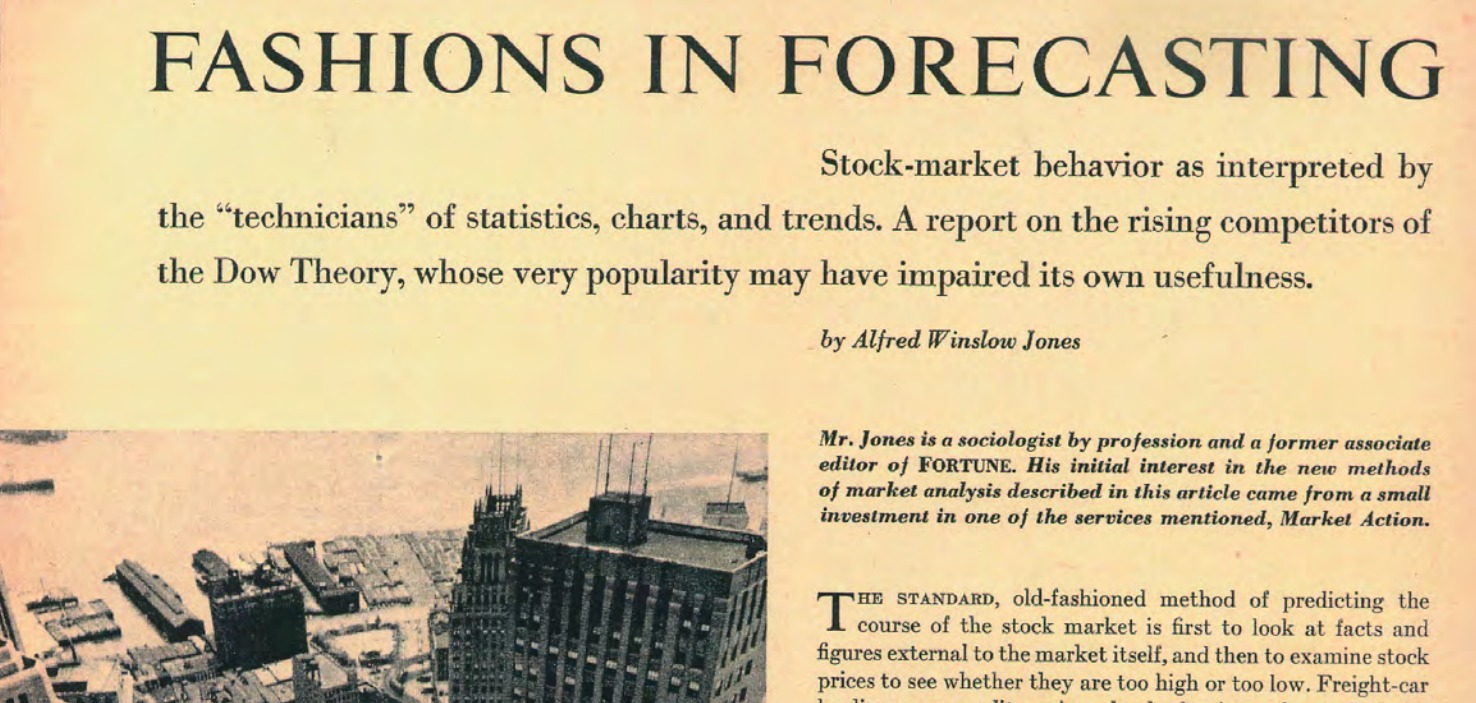
Alfred Winslow Jones ‒ a sociologist and journalist, credited with founding the first hedge fund ‒ advocated surfing the market’s mood swings in the pages of Fortune, where he worked in the 1940s.
At around the same time, commodities trader Richard Donchian was pioneering diversified trend-following strategies based on five- and twenty-day moving-average crossovers. In 1949, he founded Futures Inc, the first public managed futures fund.
Advances in information technology soon provided entrepreneurial investment managers with the ability to test technical patterns statistically on large amounts of historical data and develop computer-based strategies.
Michael Adam, David Harding, and Martin Lueck, for example, used computers to analyse historical price data in the 1980s, introducing empirical rigour to the testing of investment signals that the loose taxonomic practices of the early technical analysts lacked. David Harding would go on to champion this approach to pattern recognition at Winton, building a large team of researchers who apply the scientific method to investing.
The analysis of price patterns has evolved since it was used to trade rice derivatives in 18th century Japan. Few serious investment firms today have technical analysis at their core. There is, however, a thriving segment of the investment management industry that applies advanced technology and statistical techniques to test hypotheses about how markets behave.


